Description
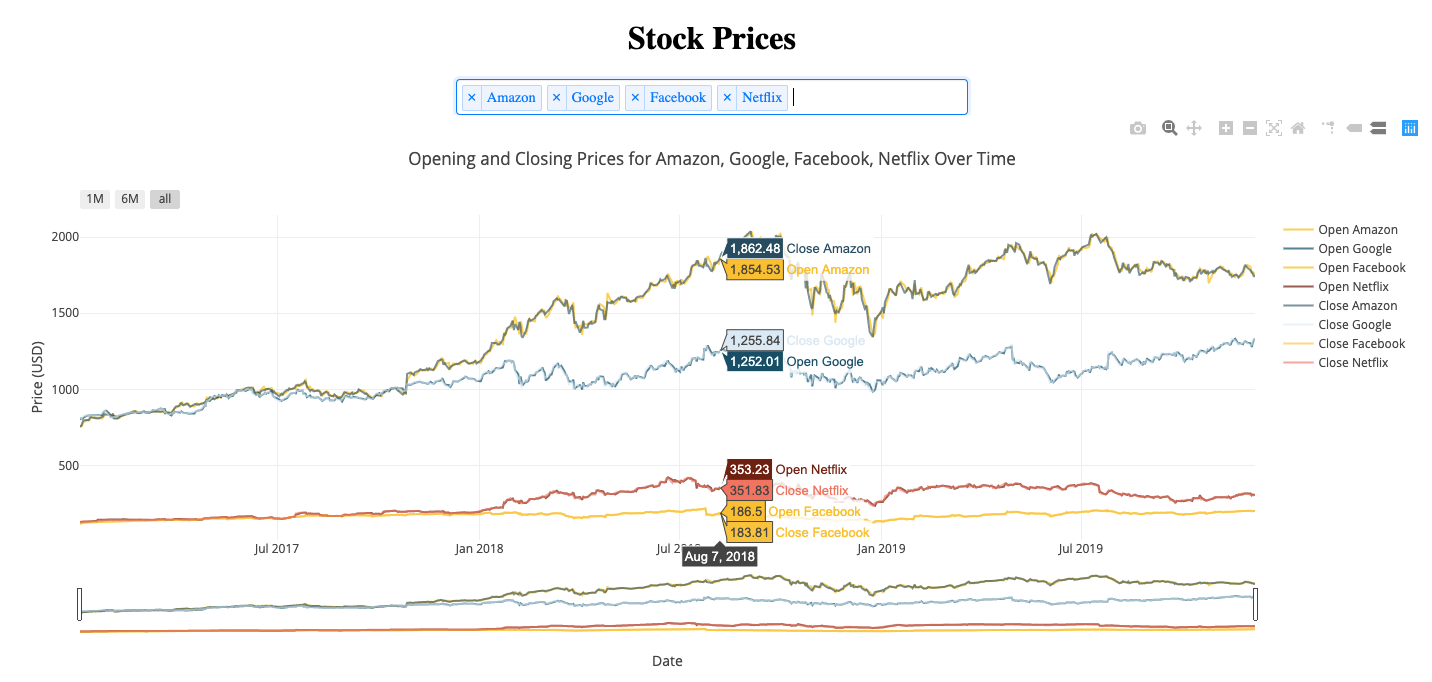
This project offers an interactive web-based representation of the historical opening and closing stock prices of leading tech giants: Amazon, Google, Facebook, and Netflix. Harnessing data from the Yahoo Finance API, the application delivers a captivating time series visualization through the synergy of Plotly and Dash. Conceived as a beginner's initiative, this endeavor stems from an enthusiasm for finance and Python-based data visualization.
Technologies Used
- Python
- Plotly
- Dash
- Yahoo Finance API
Setup and Installation
- Install Plotly: `pip3 install plotly==4.3.0
- Install Dash: `pip3 install dash==1.7.0
- Run the Application: `python3 run.py
Project Repository
GitHub Repository Go To
A work by Anuj Shah